
Rolling Returns


The annualized total return of the S&P 500 for the decade ending 2023 was 12.2%. From January 2014 through December 2023, if you reinvested dividends and paid no fees or taxes, your total return over that time would have been 216% (turning $100 invested into $316). That is an annualized total return (with dividends reinvested) of 12.2%. But that was just that decade. What about rolling returns?
I’ve warned before about using specific individual timeframes to prove a supposition. One timeframe may prove that stocks are going to the moon and cause people to euphorically invest for the first time at the top of a bubble (like 1989-98: Up 480% with an average return of 20% per year). Others pessimistically “prove” that stocks are dangerous and cause investors to flee to the “safety” of bonds and insurance products (like 1999 to 2008, down 13% over 10 years, spawning the name “the flat decade.”)
Therefore, instead of using one period to prove a principle, we will rely on rolling returns: the ongoing average of those same periods. Let’s dive in.
Rolling Returns’ Impact on Investor Behavior
We’re taking a few weeks to look at Investor vs. Investment Return. If you missed last week’s episode, “Investments (Still) Outperform Investors,” go back and listen to that. There, we saw that investors significantly underperform the S&P 500 over every period. But the numbers are different than the last time we looked at this in 2021. The 1, 3, 5, 10, 20, and 30-year returns have moved. How can we be sure of our principles when the numbers keep changing?
Instead of using a single period to prove a rule, I prefer to use rolling averages. What was the ten-year return ending each year for the last decade (spanning twenty years) or more? What’s the average of those averages? That’s how we get rolling averages. They add some consistency over time.
When we understand the rolling returns and how positively positive they are, they can help us become better investors.
Rolling Returns are Positively Positive
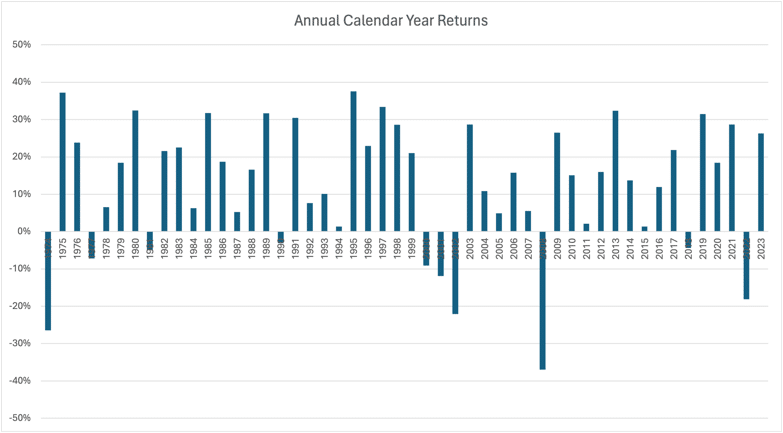
Let’s look at the rolling returns of the S&P 500 over the last fifty years ending 2023. (I’m not cherry-picking to make returns look good. The very first year is negative.) We’ll look at 1, 3, 5, 10, and 15-year rolling periods. First, here are the annual returns for those 50 years, and then we’ll make some notes.
Positive Probability
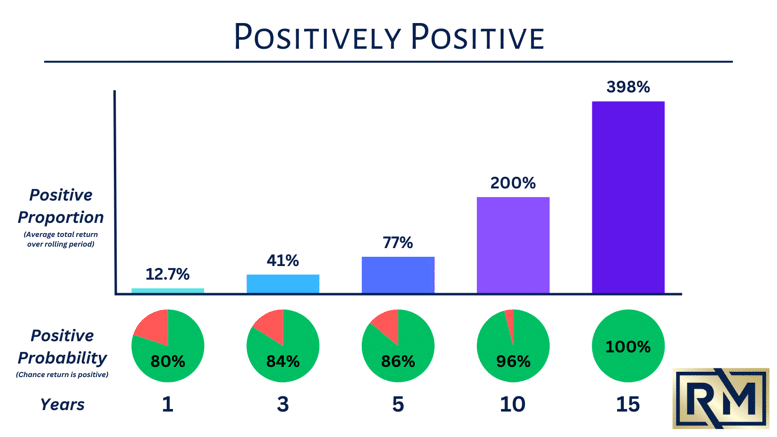
Annual returns are mostly positive, with a few glaringly bad years in there. (1974, 2000-2002, 2008, 2022). Overall, the probability that the stock market is positive over the course of a calendar year is 80%. But your chances get better the longer you hold, as shown below in the circle graphs. Over rolling 10-year periods ending the last fifty years (spanning sixty), the return is positive 96% of the time and closes to 100% over fifteen years.
People often equate “the stock market” with gambling. Tell me, what casino has an 80-100% chance of you winning?
Positive Proportion
What was the average total return (with dividends reinvested) over these rolling periods? Sure, in 16% of three-year periods, the market is down. But it’s up so much over the other 84% of periods that your average rolling return over three years is 41%.
Despite having two negative ten-year periods over these fifty years, on average, the 10-year time horizon for investing is so good that you would be up 200%. Again, because hundreds of percent are awkward, up 200% means turning $100 into $300. On average, you would have tripled your money over a 10-year period and quadrupled it over 15 (with no chance of it being down). Let’s look at those ten-year periods.
Ten-Year Rolling Returns
There are only two rolling decades that had a negative return. Can you guess what they are?
They were the decades ending 2008 and 2009. Why were they negative? Because you are measuring from the top of the Dot-com Bubble to the bottom of the Great Financial Crisis. Look at the end of the 1990s. Five years in a row of 20%+ annual returns. Is that because it was recovering from a crash? No. The four prior years were also positive.
Now, look at the rolling returns.
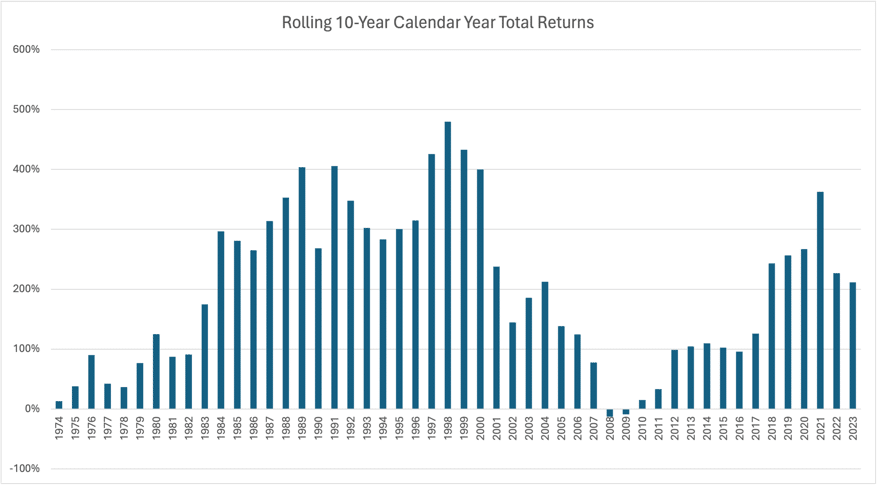
From 1998-2000, the ten-year rolling return was over 400% gain. You would have 5x’d your money. That’s abnormal. That’s a bubble.
When you measure from the top of a bubble to the bottom of crash, you’re going to get a negative return.
The Flat Decade
But didn’t people get screwed investing in equities because of the flat decade? Only those who succumbed to Euphoria or Panic.
If you started investing in 2000, then the Dot-Com Crash and the Great Financial Crisis were the best things that ever happened to you. You’ve had great sales to buy in at the beginning of your investing journey.
But what about those who were trying to retire in 2010? Their entire final decade was a total slump.
If you had been an equity investor before that, you would have had such tremendous gains through the 1990s that those two crashes would have merely brought you back down to what was reasonable.
The only ones who were hurt by these were the ones who waited to get into equities until the end of the 90s, ignoring all the data and information about investing before then, and got in at the top for the first time. Yes, they were hurt.
But that’s not you, right? You are invested now. You are going to stay invested. And this won’t happen to you.
What About Monthly Rolling Returns?
So far, this has all been calendar-year rolling returns. But people retire all throughout the year. People have emergencies requiring withdrawals all throughout the year. Life happens monthly, not annually.
They only have monthly total return data going back to 2000. To me, 24 years is not enough time for good rolling ten-year data. But it’s plenty of time for three-year rolling periods. Let’s look.
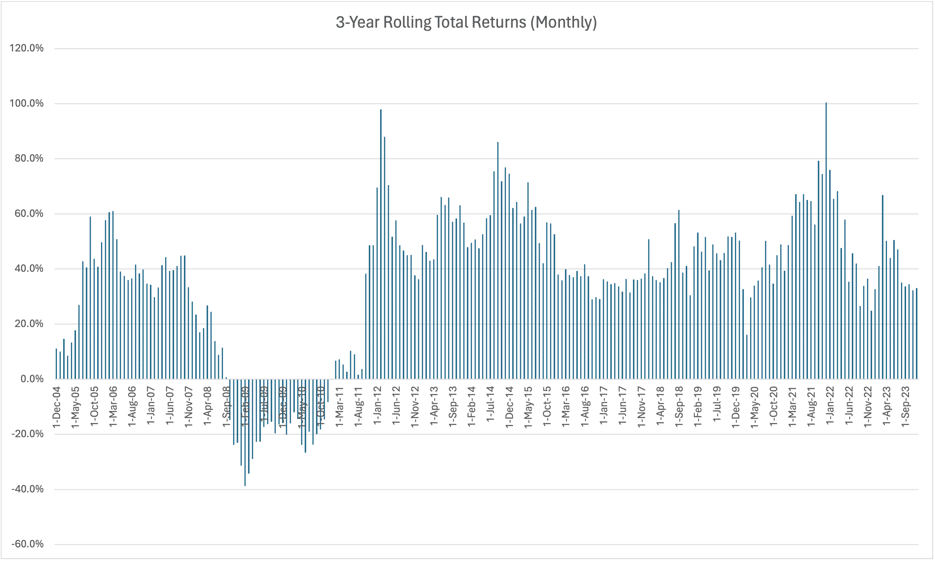
So when we say that 3-Year Rolling Returns are positive 81% of the time, we mean that black swan events like the Global Financial Crisis will add in some negative returns. Outside of that, all three-year periods were positive. The lowest point since then is the period ending March 2020—the bottom of the Crash. For a brief moment, you were only up 16% from three years before (and right back to 30% the month after and beyond).
Does this mean we invest all of our short-term savings into the market? No. We still apply all prudent investing rules.
It means that the next crisis-induced market drop many not take five to ten years to recover from. More likely, you’ll be back to positive returns within three years, and returns that are markedly better than you can get anywhere else.
Conclusion
Investors underperform investments because they don’t mentally and emotionally understand how equity investing truly works. When you are a business owner in the best businesses in the world, your returns are positively positive. Just give it time. And maybe even less time than you think.
Want More? Become a RetireMember!
Get my book, 3D Retirement Income, for free, as well as access to live events, checklists and flowcharts, and wise counsel from one of the best minds in behavioral investing. Join today for free.
Need Help? Work with Me.
Schedule a Discovery Meeting with me through my Financial Planning firm, La Crosse Financial Planning. This no-cost, no-obligation conversation will determine what you are looking for and how we can help you retire successfully and stay successfully retired.
This article is educational only and is not intended to be investment, legal, or tax advice or recommendations, whether direct or incidental. Again, this is not investment advice. Consult your financial, tax, and legal professionals for specific advice related to your specific situation. Never take investment advice from someone who doesn’t know you and your specific situation. All opinions expressed in this article are those of the people expressing them. Any performance referenced is historical and is no guarantee of future results. All indices are unmanaged and may not be directly invested in.